Grafana
Grafana is a popular observability and monitoring application used to visualize data and enable time-series data analysis.
QuestDB is available within Grafana via the official QuestDB plugin.
QuestDB can also be used with the PostgreSQL Grafana plugin, but the configuration options are different in that case. The QuestDB official plugin is strongly recommended instead.
For a walk-through style guide, see our blog post.
Prerequisites
- Docker to run both Grafana and QuestDB
- We will use the
--add-hostparameter for both Grafana and QuestDB.
- We will use the
Start Grafana
Start Grafana using docker run:
docker run --add-host=host.docker.internal:host-gateway \
-p 3000:3000 --name=grafana \
-v grafana-storage:/var/lib/grafana \
grafana/grafana-oss
Once the Grafana server has started, you can access it via port 3000
(http://localhost:3000). The default login credentials
are as follows:
user:admin
password:admin
Start QuestDB
The Docker version runs on port 8812 for the database connection and port
9000 for the Web Console and REST interface:
docker run --add-host=host.docker.internal:host-gateway \
-p 9000:9000 -p 9009:9009 -p 8812:8812 -p 9003:9003 \
-v "$(pwd):/var/lib/questdb" \
-e QDB_PG_READONLY_USER_ENABLED=true \
questdb/questdb:latest
Add a data source
- Open Grafana's UI (by default available at
http://localhost:3000) - Navigate to the bottom of the page and click Find more data source plugins.
- Search for QuestDB and click Install.
- Once the QuestDB data source for Grafana is finished installing, click on the blue Add new data source button where the Install button used to be.
- Enter the connection settings.
- Notice that
Server Addressis the host address without the port. Some common values arehost.docker.internalwhen using Docker on the same host,localhostwhen running standalone Grafana on the same host, or the QuestDB instance IP address when running Grafana remotely. - The port, which defaults to
8812is passed as a separate parameter. - For QuestDB Open Source, TLS/SSL mode should be
disable. This can be left empty for QuestDB Enterprise.
- Notice that
Server address: host.docker.internal
Server port: 8812
Username: user
Password: quest
TLS/SSL mode: disable
-
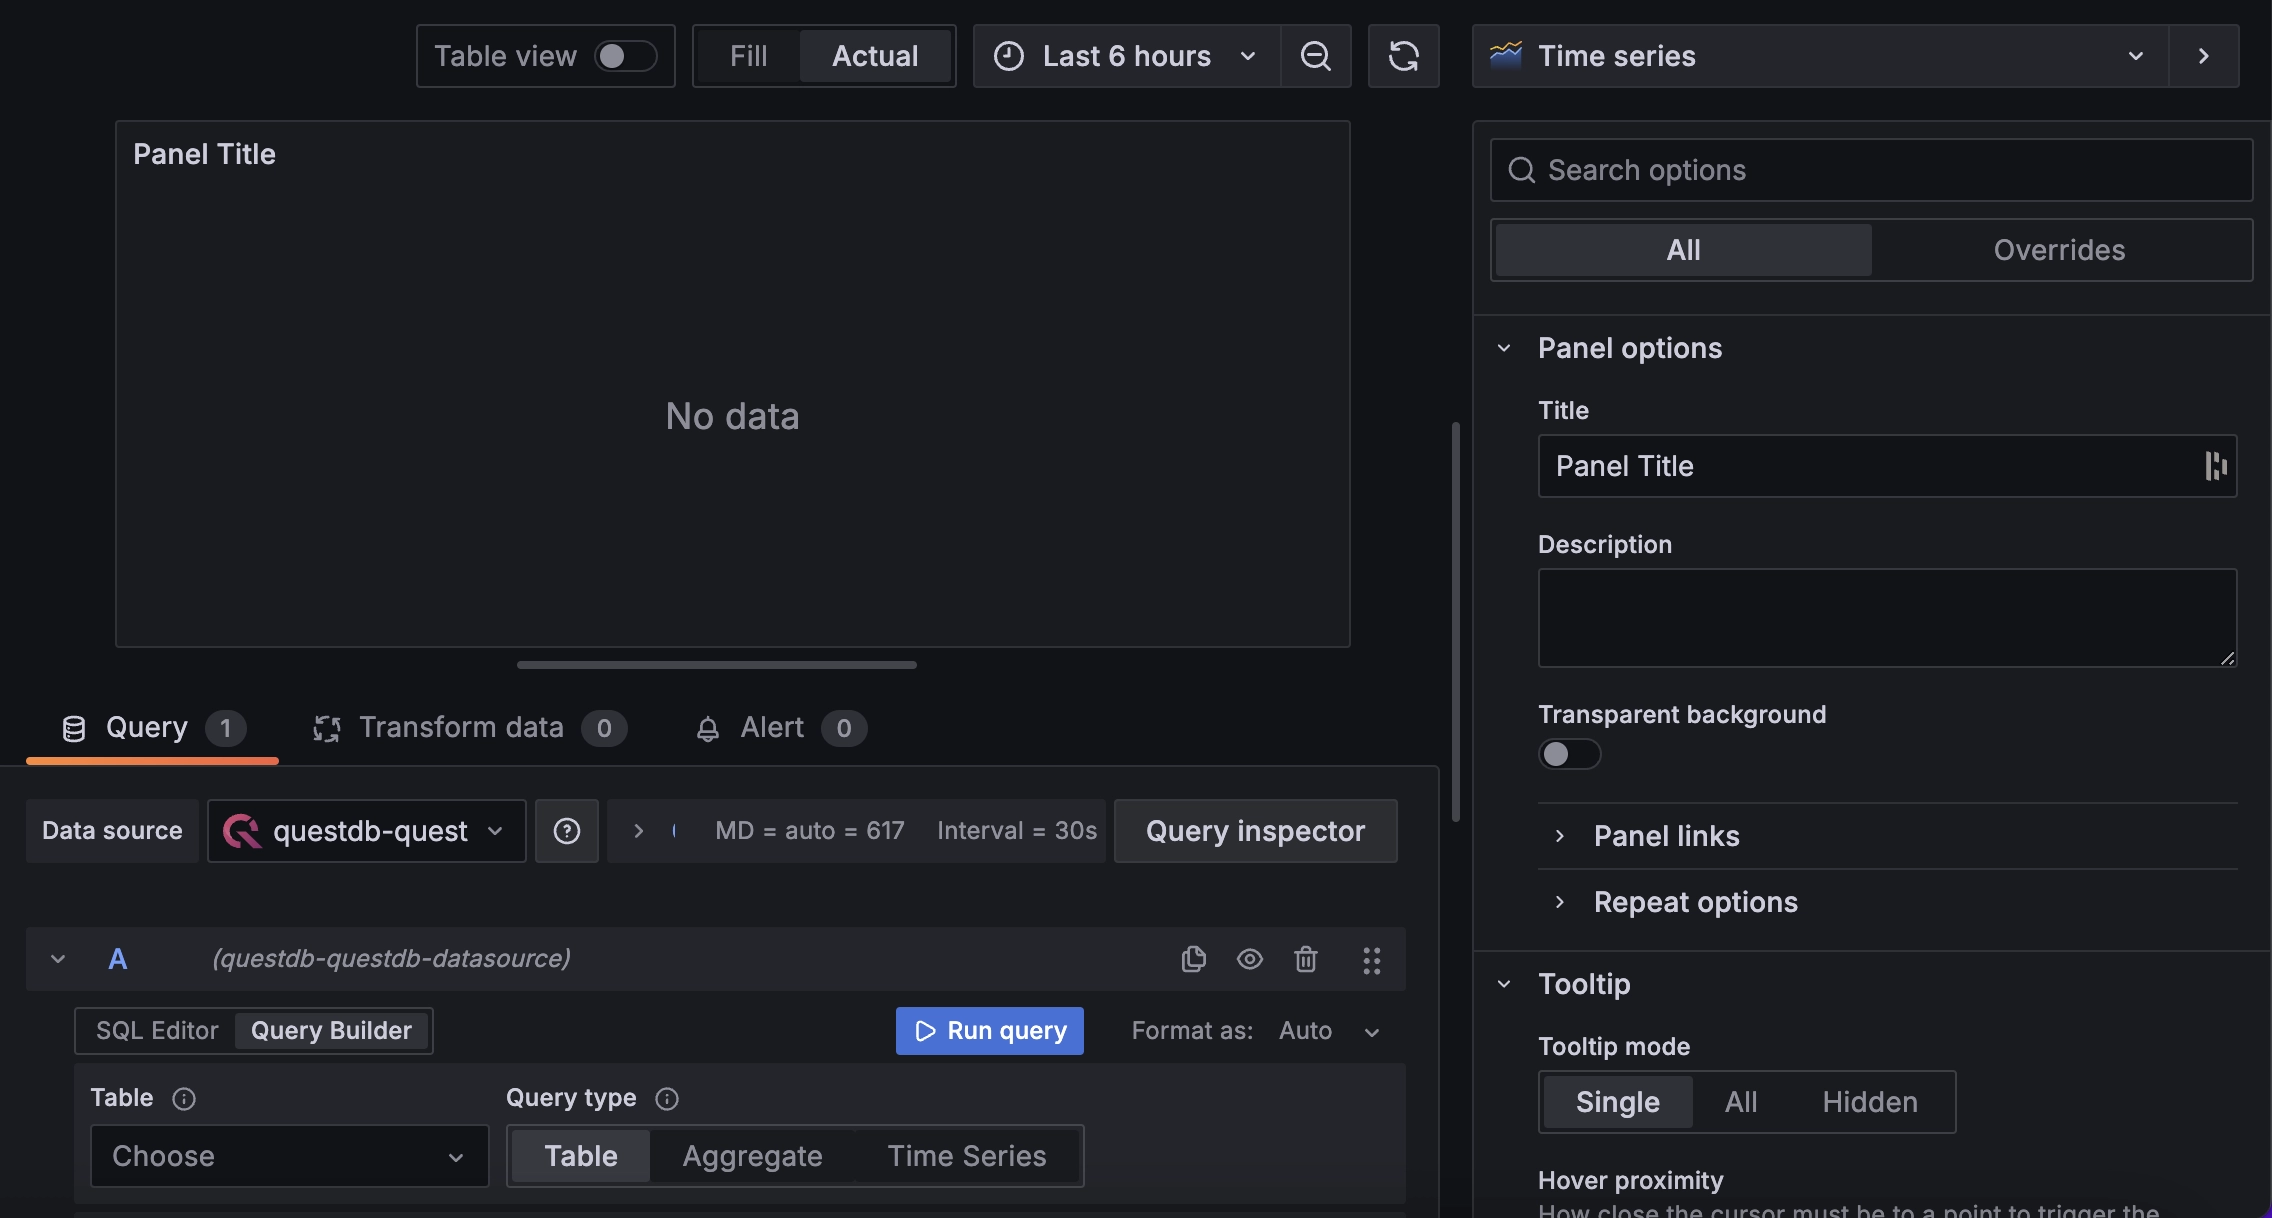
Toggle the Query Builder to SQL Editor by clicking the button.
-
Write SQL queries!
Real-time refresh rates
By default, Grafana limits the maximum refresh rate of your dashboards. The maximum default rate is to refresh every 5 seconds. This is to provide relief to the database under-the-hood. However, with QuestBD's significant performance optimizations, we can lower this rate for greater fluidity.
To learn how, see our blog post.
Query macros
The QuestDB Grafana plugin provides macros that are expanded before the query is sent to QuestDB. Use them to inject the dashboard time range and dynamic intervals into your SQL.
$__timeFilter(columnName)
Filters a timestamp column to the panel's time range:
-- expands to
columnName >= cast(1706263425598000 as timestamp)
  AND columnName <= cast(1706285057560000 as timestamp)
$__fromTime / $__toTime
Start and end of the panel's time range, each expanding to a
cast(... as timestamp) expression. Useful in WHERE clauses and
arithmetic, but cannot be used inside DECLARE blocks because the parser
does not support cast in that context. See the
DECLARE with time range
recipe for a workaround.
$__sampleByInterval
Dynamic interval for SAMPLE BY, using QuestDB time units
(s, T for milliseconds, h, d). The interval adjusts automatically
as the user zooms in and out of the panel.
$__conditionalAll(condition, $templateVar)
Returns condition when the template variable has a specific selection,
or 1=1 when "All" is selected. Useful for optional WHERE filters:
SELECT timestamp, symbol, price
FROM trades
WHERE $__timeFilter(timestamp)
  AND $__conditionalAll(symbol = '$symbol', $symbol);
SELECT
  timestamp AS time,
  avg(price) AS avg_price
FROM trades
WHERE $__timeFilter(timestamp)
SAMPLE BY $__sampleByInterval;
Grafana global variables
Grafana also provides
global variables
that are interpolated before the query reaches the plugin. The most useful
ones for QuestDB are $__from and $__to, which expand to the dashboard
time range as epoch milliseconds. These are plain numbers and can be used in
DECLARE blocks after converting to the right precision.